Scheme and photo of the QCM cell as a mass sensor |
|
 |
 |
Scheme and photo of the QCM cell as a viscometer |
|
 |
 |
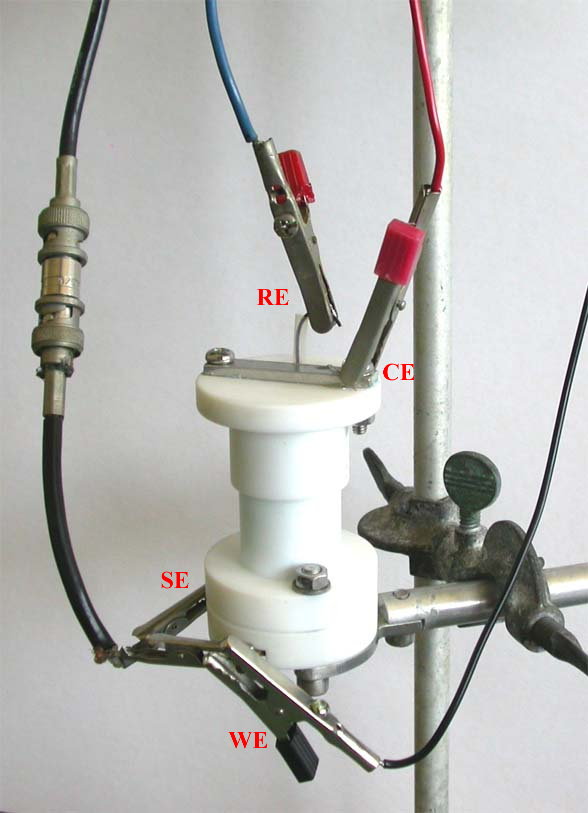
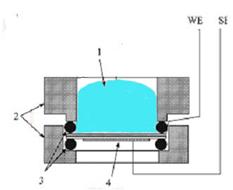
There are two parts in this experiment: in the first you will use the QCM as a mass-sensor (Figure 1), and in the second you will use it as viscometer (Figure 2). The components for the two parts are very similar, and they are listed below. The first four elements are marked as numbers on each scheme; the electrodes are marked by letters.
- Electrolyte
- Teflon holder
- Viton O-rings
- Gold-covered quartz crystal resonator. The electrode's surface area is 0.91 cm2.
- RE - reference electrode, made of Cu-rod; CE - counter electrode, made of Pt-wire; WE - working electrode; SE- supporting electrode. WE and SE are used to induce vibration in the quartz crystal resonator.
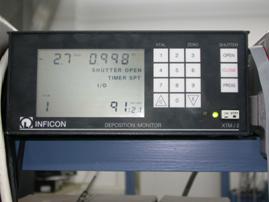 XTM: measures the fundamental frequency, i.e. the frequency corresponding to the maximum of the curves shown in figures 4 and 5 of the theoretical background. It is under overall management by your computer: use only the on\off button.
In case of system failure, the message "XTAM fail" will appear on the XTM monitor. Please notify the instructor in this case!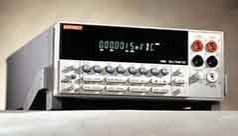 Digital multimeter: used to measure the potential between Reference and Working electrodes. It is under overall management by PC: you use only one button "POWER" to switch it on or off.
-
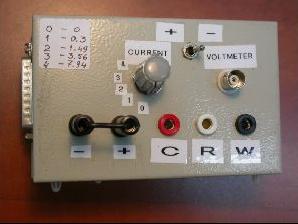 Power supply: The connector holes, C, R and W, serve to connect counter, reference and working electrodes, respectively. The two left connector holes have to be short-circuited! The potential between the working and reference electrodes is measured by a digital voltmeter through BNC connector. Position of the knob (0-4) determine the current (mA) passed through the cell in accordance with the table (located on the upper left corner of the box). the polarity of the current can be changed by the switch: (-) - deposition; (+) - dissolution.
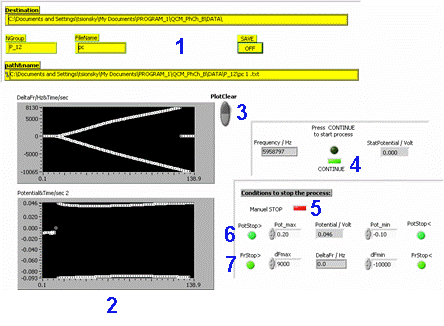
Control software:
Screenshot of the control software of the mass sensor experiment |
 |
Software components:
- Saving files: You must create a folder with your group name (such as p_#, where # is your group number). In order to save a file, enter your group number and the file name. Remember to turn on the save option!
The data is saved in a text file. The columns are as follows: time (sec), current (mA), Δf (Hz), voltage (V), f (Hz). - Frequency (top) and voltage (bottom) graphs.
- "Clear plot" button.
- Press "Continue" when you are ready to start the experiment, after you have set all your parameter.
- Press "Manual STOP" if you want to terminate the experiment before the pre-set parameters are reached.
- Set minimum and maximum potential. Potential control in the electrochemical processes is imperative!
- Set minimum and maximum frequency difference (Δf). This parameter will determine the thickness of the deposited or dissolved layer.
Why are the last two parameters so important?
The copper deposition/dissolution in this experiment is performed at constant current (so-called galvanostatic regime). The potential of the working electrode (between WE and RE), which is measured by a digital voltmeter, is a free parameter. This parameter determines what kind of reaction takes place on the working electrode. For example, some layer of copper covers our working electrode. The reference electrode (RE) also consists of copper. It means that at zero current the measured potential equals zero (practically it will be close to zero within few millivolts). When anodic current will be applied, the copper of the WE will start to dissolve and the potential will get a positive value. This shift defines overvoltage. If we polarize the electrode sufficiently long time all the copper will be dissolved from the electrode. To provide the current applied to system the potential will rise up to values corresponding to other reaction. Our solution contains CuSO4, H2SO4 and water. Thus, the nearest possible reactions will be evolution of oxygen or dissolution of gold (see half cell potentials table). In the experiment, you will use a gold-covered QCM electrode. Removing gold from one of its sides will destroy the resonator, causing oxygen evolution. Hydrogen evolution may happen if the negative potential at cathodic currents becomes close to -0.34V for some reason. Evolution of oxygen or hydrogen produces bubbles on the surface of the QCM, and may disturb its operation.
To avoid these problems, the program controlling the experiment defines two limiting values of potential, negative and positive (right lower frame on the Control Panel). If the measured potential goes beyond these limits, the applied current is switched off automatically and one of green indicators will be turned to red showing what parameter was exceeded. The limits of frequency changes are constructed in the same manner.
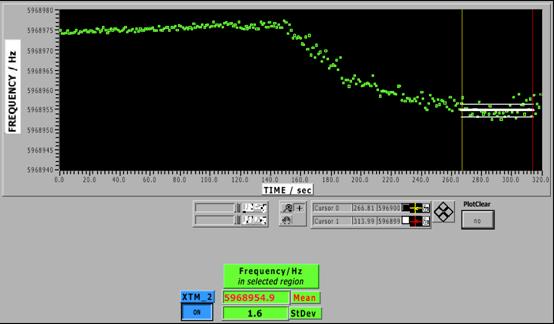
Screenshot of the control software of the viscometer |
 |
Software components:
- Absolute frequency graph. The vertical lines define the selected region, and the vertical lines show the mean frequency and its standard deviation.
- Clear plot button. Clear the plot only when you absolutely have to! (e.g., when the setup was accidentally hit, and a point was recorded very far from the experimental range.)
- XTM on/off button.
- Values of the mean frequency and its standard deviation.