Inversion of light polarization by sucrose hydrolysis
In this experiment you will study the acid-catalyzed hydrolysis of sucrose.
Experimental Procedure
Part One
Changing the Light Polarization of the Laser Beam with Mirrors
- Try to change the laser polarization by 90° with two mirrors.
- Try to change the laser polarization by 90° with only one mirror.
- Confirm that the polarization has changed.
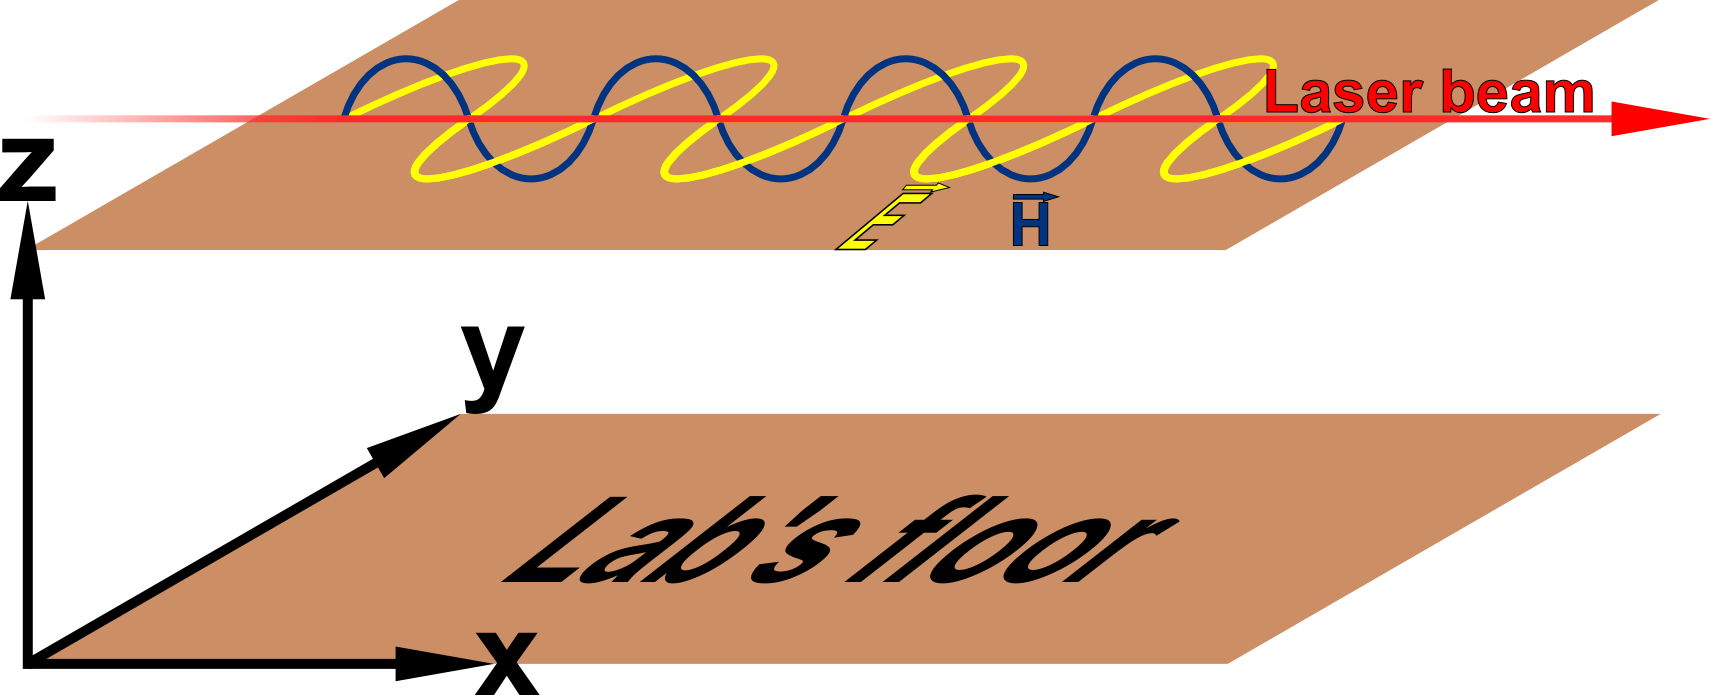
Note that the laser's polarization is linear, and you need to change it by 90° in the lab frame as shown in Figure 1. The linear polarization of the laser can be in any initial direction for that matter.
Verifying Malus' Law
- Construct an experimental system that contains a laser, a polarizer, a photodiode and a power meter.
- Shoot the laser beam through the polarizer and measure the beam intensity as you change the polarizer angle. Notice that first you need to find the minimum or the maximum intensity.
- Fill out a table of intensity versus angle and plot the graph that verifies Malus' law.
Part Two
Find $[α_0]$ and $[α_∞]$
- In order to find $[α_0]$, dissolve about 15 grams of sucrose in water. Make sure that the total volume of the solution is 60 ml. DO NOT dissolve the sucrose in 60 ml of water (why?). Dissolve the sucrose in a measuring cup in less than 60ml and in less than 60 ml of water and then transfer the solution to a volumetric flask and fill to 60 ml.
- In order to find $[α_∞]$, first you need to calculate how much fructose and glucose you need to dissolve, assuming that the sucrose will be fully converted to fructose and glucose.
- Dissolve the right amount of fructose and glucose in 60 ml of water.
- Important Remarks!
- You have to make sure that both solutions are well mixed and homogeneous otherwise the laser beam will not travel in a straight line (why?).
- You have to wait for about 1 hour from the time you have prepared the fructose and glucose solution until you make your measurement (why?).
- Calculate $[α_0]$ and $[α_∞]$ and:
- Use the equation $[α]_{He-Ne}·λ^2_{He-Ne} = [α]_D·λ_D^2$ to check if your observation fits the values from the literature.
- Remember that the specific rotation $[α_∞]$ refers to two compounds while the specific rotation $[α_0]$ is defined by only one compound. Think how to validate your result for [α∞].
Determine the Rate and Mechanism of Acid-Catalyzed Hydrolysis of Sucrose
- Prepare five solutions of sucrose with different concentrations of acid. You will have at your disposal an HCl acid at a concentration of 32% by mass. Think and calculate in advance how to dilute 15 g of sucrose in the acid, taking into account that the
sucrose needs time to dissolve and once the acid is introduced, the reaction starts.
Solution # Sucrose dissolved [grams] Time to wait
between measurements [min]Acid concentration [Molar] How will you prepare the solution? 1 around 15 5 0.7-1.0 ? 2 around 15 3 1.1-1.4 ? 3 around 15 2 1.5-1.8 ? 4 around 15 1 1.9-2.1 ? 5 around 15 1 2.2-2.5 ? - Before you start your measurements, it is wise to place the polarizer at the angle you identified in the previous experiment for the dissolved sucrose. This way, you will not waste time looking for the correct angle. You will only have to slightly adjust the polarizer to fit your needs. For each solution fill in the table below with the angle you measure as a function of time of the reaction.
- After acquiring all the data needed, use equation (27) to find k for each of the four solutions.
- Plot k as a function of the acid concentration and compare you result to the article "Acid-Catalyzed Hydrolysis of Sucrose - A student study of a reaction mechanism" by J. G. Dawber, D. R. Brown and R. A. Reed. It can be downloaded from here.
- From the data presented in the paper, obtain a function that represents the trend in the change of the Hammett acidity function H0 versus molarity. Extract the H0 values that correspond to the molarities you worked with, and plot log10k as function of H0. Find the other two plots described in the paper and recreate them from your data. Compare your results with those reported in the paper.
| time [min] | α [deg] |
| ... | ... |
| ... | ... |
| ... | ... |