For Hebrew abstract
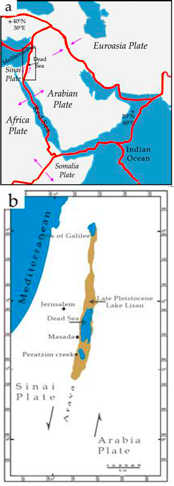
The Dead Sea region had been occupied by several water-bodies during the tectonic depression along the Dead Sea Transform (DST) at the Neogene-Quaternary. The region evolved through phases of dehydration from the largest and earliest of these water bodies the marine Sedom lagoon, to the Lake Amora (Samra), existed from the early to late Pleistocene, Lake Lisan (~70 – 15 kyr B.P.) and finally the Holocene Dead Sea.
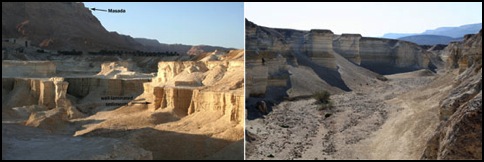
Pictures from the research area, The Lisan Formation
The aim of this study is to document and interpret series of seismic features of the Lisan Formation in the Dead Sea region. In this work we discuss the seiemogenic origin of the soft sediment folded deformation and the onset primary conditions. These unique type of lacustrine folds remarkably resemble a well-known phenomenon from the world of fluid dynamics; Kelvin-Helmholtz instability.
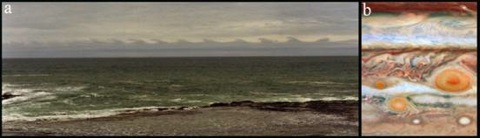
Natural KHI. a) Atmospheric Kelvin-Helmholtz instability patterns above the horizon, New Zealand. Conditions of strong stratification, humidity and shear provide development of such KHI clouds. Photographed by Mr. Attay Harkavi, January 1999. b) KHI patterns within the atmosphere of Jupiter.
Model such as shear instability are commonly used to describe atmospheric and oceanic processes. In this study we attempt to use this approach in order to determine the nature of the relation between the billow-like folds of the Lisan Formation and regional earthquakes properties. We attempt to evaluate the regional sediments parameters (density and viscosity) of the paleo-lake Lisan for numerical modeling purposes.
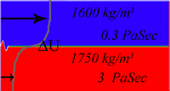
Illustration of the sedimental configuration "before and after" earthquake. Left figure, (before), well bedded sediments stratified horizontally at bottom of Lake Lisan. Right figure, (after), deformed structures in the shape of billows created as a result of ground shaking by a regional earthquake. In response to shaking the less danced layers slide on top of the relatively heavy layers at the bottom, creating velocity shear that allows small perturbations to grow by the conditions of instability, while deeper laminas remain intact. Folded laminas were copied from photograph taken at the Lisan Formation, under Masada.
This model gives us the impact ratio between peak ground acceleration (PGA) to the degree of the deformation. The guideline model is a configuration of perturbated shear instability in the type of KHI, formed by the ground acceleration induced by earthquakes, creating a velocity shear between two horizontal layers of sediments at the lake's floor.
We perform a set of geometrical examination to more then 300 soft sediment deformed structures exposed along the Lisan Formation.
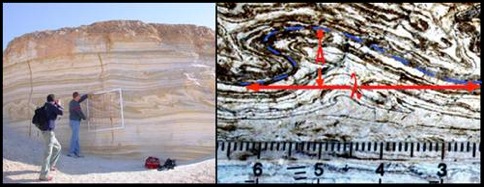
Measurement technique. The photographing of large scale folds by the use of 1x 1m aluminum grid, with resolution of 10cm. Perazim creek (left). Amplitude and wavelength of a single fold-sample, Marked by dashed blue line. Wavelength is marked by red arrow. Notice the small scale features; ruler at the bottom scaled by millimeters. Photographed near Masada (right). We suggest that these folds evolved through stages of linearity to non-linear coherent billows, under the influence of shear instability, and into a final stage of turbulence. Spectral analysis of these coherent billows indicates a uniform behavior and high spectral correlations to the Kolmogorov turbulence power law of -5/3.
This special power law is compatible to turbulent nature of shear instability mechanisms such KHI. The feasibility of such mechanism is also dependent on the configuration of the density profile and the composition of the medium. Therefore we obtain the reconstructed properties of the sediments in its wet condition for modeling purposes as we evaluate viscosity and density of this complex material.
CFD simulations. 6 Simulations of a 2m by 0.4m mesh. The velosity inlet of the fixed to 1m/s. The velosty inlet of the top layer is v(t)=1+at m/s.
Physical parameters of the layers:
Top ρ=1600 kg/m3 μ=0.3 Pas
, Bottom ρ=1750 kg/m3 μ=3.0 Pas
Visual comparison between deformed sediments to CFD simulations. Scale of field photographs are exactly as the CFD model captures 20 x 40 cm, and represent the density profile at T=1 sec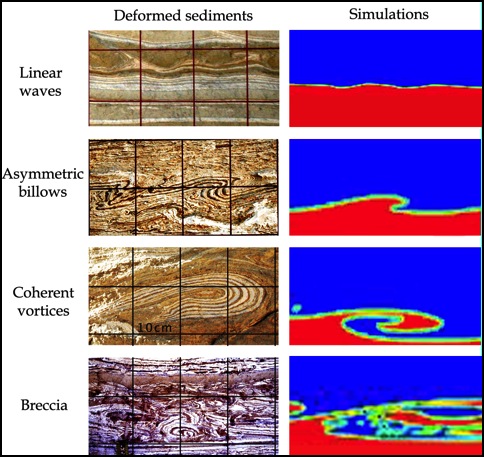
Some links:
Fluent and KHI
Soft sediment deformation by Kelvin-Helmholtz Instability: A case from Dead Sea earthquakes