How to use SEE Path Segmentor
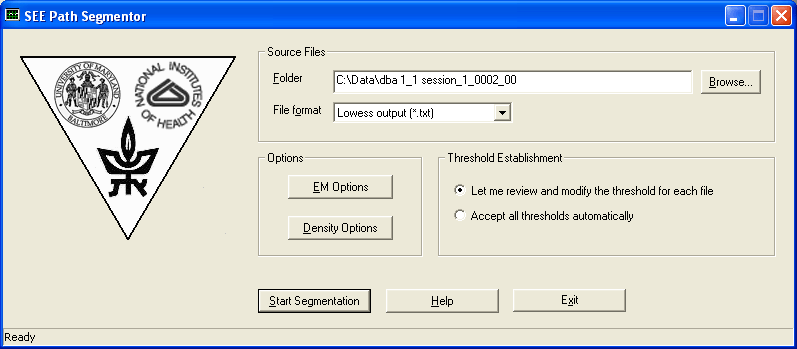
Here is the main dialog of the SEE Path Segmentor. Following are the
instructions how to use this dialog box.

- By now you have smoothed the data by using SEE Path Smoother. You have also started SEE Path Segmentor by running the
"SEE Path Segmentor.exe" file.
- Select the folder of the input files by clicking the Browse button,
or enter manually.
Note:
- Path Segmentor will process all files in that folder.
- This folder will also be the folder where the output file is created.
- Choose the desired input File Format:
- Smoothed data (*.txt): Output of SEE Path Smoother.
- Mathematica List (*.lst): A list imported from Wolfram's
Mathematica program.
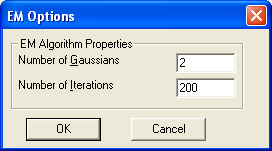
- Click on the EM Options button and set the following parameters:

- Number of gaussians: The considerations for choosing the number of gaussians in the EM algorithm are
rather involved and will be explained in a later help version of this program. We presently use as
default 2 gaussians.
- Number of iterations: We find 200 iterations to be sufficient.
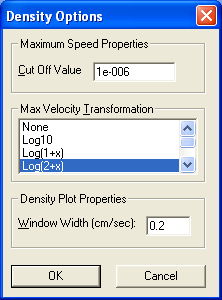
- Click on the Density Options button and set the following parameters:

- Cut Off Value: Leave at default value.
- Max Velocity Transformation: Considerations for using the various VMax transformations will be
added in a later version of the help. We presently recommend on the Log(2+x) transformation for
mouse behaviour phenotyping.
- Window Width: Influences only the graphical visualization of the density (it does not affect
the EM algorithm). Recommended value 0.2 cm/sec.
- Press the Start Segmentation button. For each input file a Density
Visualization Dialog box
will
be opened. This dialog box is used to interactively generate the cut off point (threshold) that
distinguishes between lingering episodes and progression segments. Refer to the
Density Visulaization Dialog for explanation how to use this dialog box. Once the threshold is approved by the user, it will
be stored in the ".inf" file.


