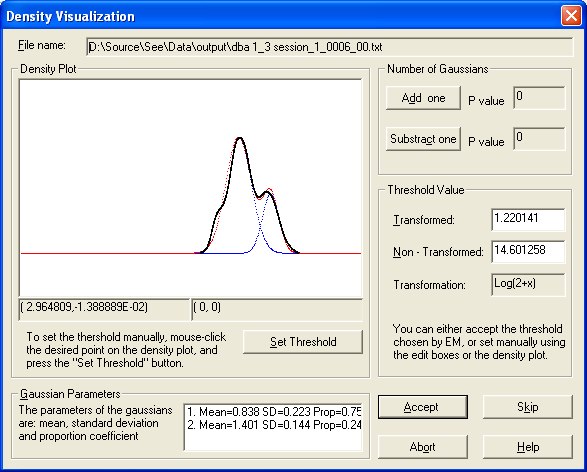
This dialog presents a visualization of the max velocity density plot, along with a superimposed graph of the EM fitted gaussians. The user can either accept the threshold suggested by the program, or set the threshold manually.

Note that the density function is performed on the transformed data (according to the Max Velocity Transformation that was chosen). The density graph can be affected substantially by the selected transformation.
Once you are satisfied with the selected threshold, press the Accept button. The threshold will be stored in the ".inf" file. You can also choose to either Skip this file, or Abort and return to the main dialog.