
GenomeGems - Evaluation of Genetic Variability from Deep Sequencing Data
Manual Reference Page
Contents:
- Download User Manual
- General
- Software & System Requirements
- Workflow Overview
- Main User Interface
- Input Files Format
- Analysis Tools
- Application Summary
- Contact
General
GenomeGems is a useful tool for analysis and visualization of data acquired by Deep Sequencing essential for researchers investigating the origins of disease-causing mutations . The input files contain lists of SNPs after analysis by MAQ, in a pre-determined format.
GenomeGems performs simple comparisons using graphs and tables of data produced from different samples, and a wide and detailed visualization of the Deep Sequencing pre-processed data. GenomeGems integrates well with the University of California Santa Cruz (UCSC) Genome Browser for the purpose of SNP visualization within investigated chromosomes. This function is made possible by development of algorithms for conversion of a pre-processed input data to a Personal Genome SNP data format (PgSNP) , which can be viewed and further analyzed using UCSC . In addition to all of this, GenomeGems suggests a few useful external databases for further SNP investigation.
GenomeGems enables researchers to identify a disease causing mutation in an efficient manner from pre-processed genomic data. Compared to currently available tools for visualization of Deep Sequencing data, its main advantage lies within the improvement of the final steps of data analysis and hypothesis generation, based on large datasets of genomic data.
New in Version 3.0
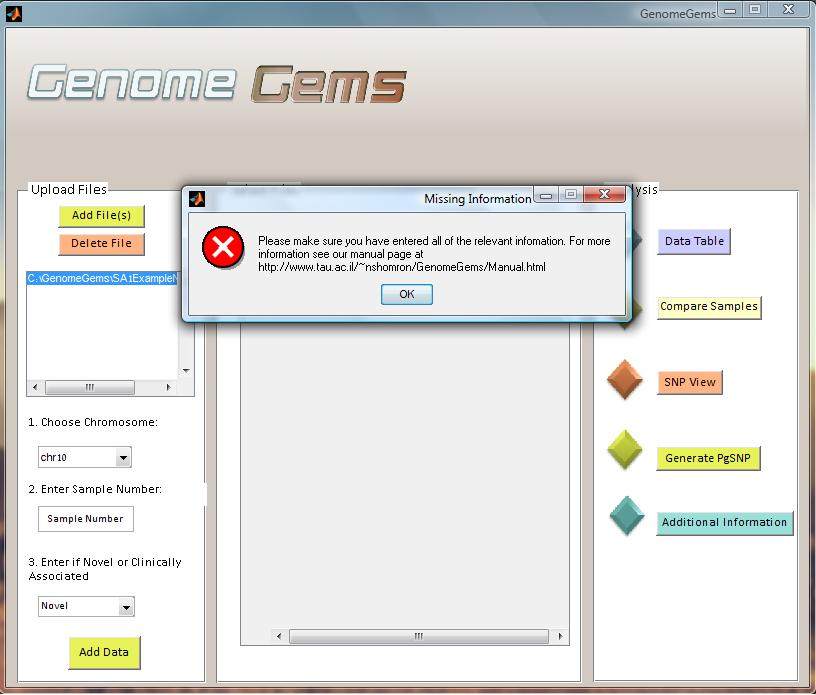
Version 3.0 of GenomeGems, released in March 2012, includes validation of data input. This involves validation in the main screen of GenomeGems, as well as in the different analysis screens. An error will appear in case any information required for analysis is missing.
Software Requirements
Workflow Overview
A basic implementation of GenomeGems has been developed, which enables the user to analyze and visualize the input data according to the flow chart in Figure 3 .
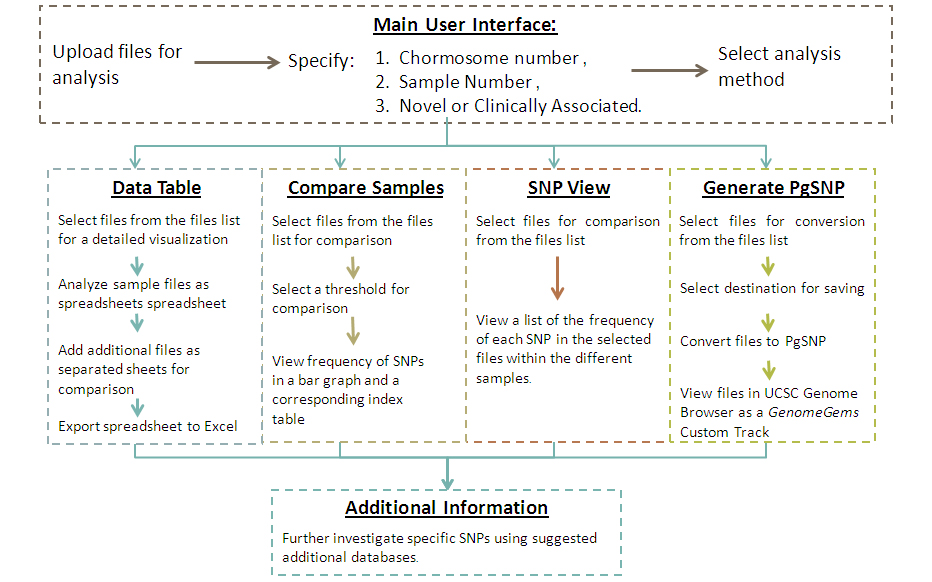
Figure 3 - An illustration of the different analysis functions of GenomeGems in a schematic workflow. The user uploads the SNP files in the pre-determined format and chooses the form of analysis required: translation to a PG-SNP file format for UCSC visualization, visualization via data table, sample comparison via bar graph or table. In addition, more information about investigated SNPs can be obtained by using the suggested links to external databases.
Main User Interface
The main user interface contains three distinct panels : (A) Upload Files, (B) Select Files and (C) Analysis. The Upload Files panel contains a list into which you upload the input files, select a chromosome on which the analysis will be performed, specify the sample number and specify whether the data is of novel or clinically associated SNPs. You may upload multiple files containing multiple samples, but each file must be of one single sample. You may also choose multiple chromosomes on which the later analysis will be performed.
The selected files, with a specified sample number, chromosome number, novel or clinically associated and location appear in the Select Files panel as a list. This list of files must include all of the files that are needed for the later analysis. At any stage you may return to the main user interface in order to add more files to be available for analysis. The Analysis panel contains the different functions available for analysis. At the moment, the tool contains five options for analysis: Data Table, Compare Samples, SNP View, Generate SNP, and Additional Information. In the future, additional forms of analysis may be added to this panel, as the tool is built in a modular form, allowing for unlimited further expansion.
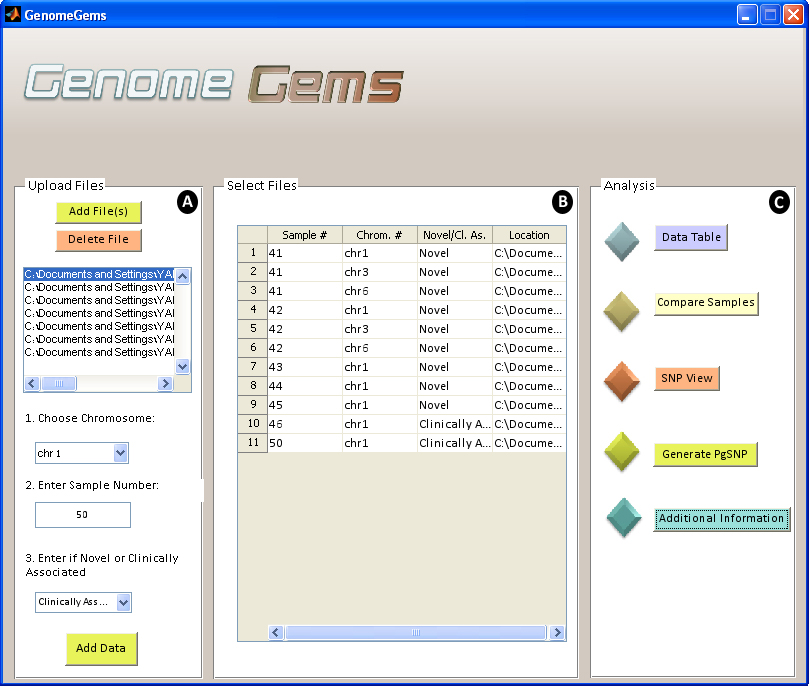
Figure 4 - The GenomeGems main user interface contains three distinct panels, (A) Upload FIles, (B) Select Files and (C) Analysis. The user may upload an unlimited number of samples and chromosomes that will later be available from each of the analysis tools . More analysis functions may be added to the Analysis panel in the future, as the tool is built in a modular design.
Input File Format
Users input a list of SNPs after analysis by MAQ in a pre-determined format. The files must be in “.txt” format and columns are separated by tab. The files must contain the following data (in this specific order):
- Chromosome number
- SNP Position
- Consensus Nucleotide
- SNP nucleotide
- Score of the SNP
- Number of Reads of each nucleotide
If any information is missing the user is directed to use “0”. Other optional information that can be submitted: Gene Name, SNP Novel/ Known, CDS (Coding Sequence)/Non-Coding, Synonymous/Non-Synonymous, Amino Acid Replacement, SNP ID for known SNPs and so on.
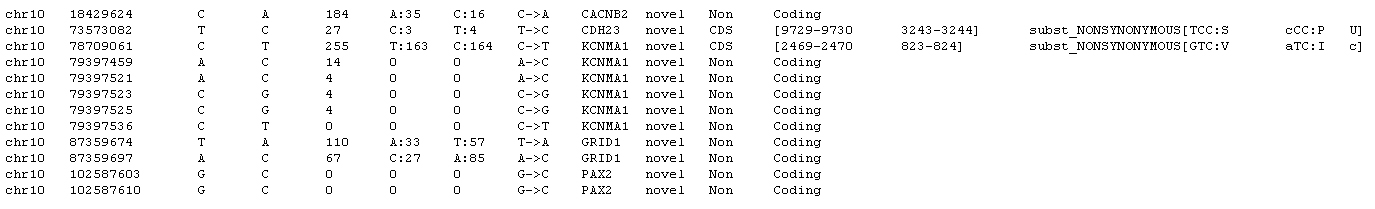
Figure 5 – Example of the input file format required for GenomeGems. The file must contain data from one single sample, and must not contain a heading line. The file may contain one single chromosome or all chromosomes, but in both cases the user must specify the chromosome for analysis. The data in the file must be separated into columns using tabs, and must contain the first 7 columns: chromosome number, SNP position, consensus nucleotide, SNP nucleotide, score of the SNP, number of reads for each nucleotide, as shown in the figure. The file may include any additional data in the following columns, also separated by tabs.
Data input is supplied by uploading the files that are to be analyzed, and choosing the chromosomes relevant for each file. This list of files and chromosomes is saved, and is later accessed throughout the employment of the tool.
Analysis Tools
Data Table
Data Table user interface enables analysis of the data uploaded by the user inside the actual tool in addition to fast export to Excel using Microsoft Office Spreadsheet ActiveX Control component. The data table visualizes the data associated with the chromosome that was selected by the user initially, and is able to show a number of samples and chromosomes simultaneously as different sheets. The data table shows all of the data that was supplied by the user, in an organized and efficient manner. In addition, the percentage of the mutant reads is displayed, for an easier further determination of the SNP Homozygocity or Hetrozycity.
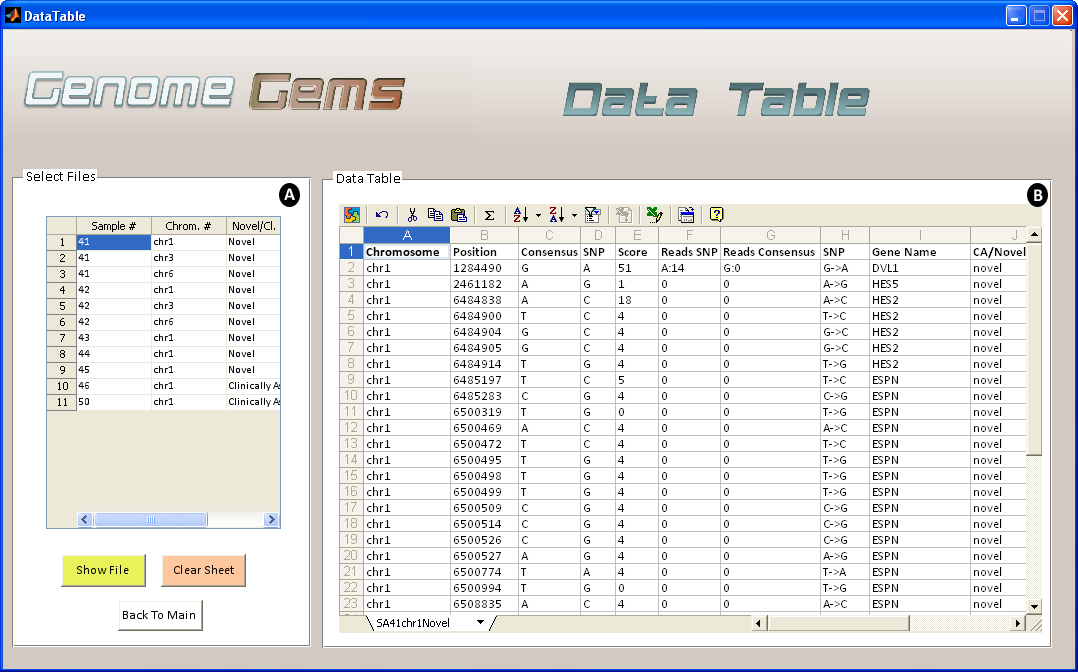
Figure 6- The Data Table analysis interface enables the user to (A) select the files for viewing, one at a time and (B) view the data in a clear and familiar MS Spreadsheet enviroment, allowing easy export to Excel. Multiple files may be shown as separate sheets.
Sample Comparison
When searching for a disease causing mutation, several samples are sequenced of a population that is either related or is diagnosed with the specific disease. When several samples are uploaded into GenomeGems, the user may compare samples and calculate the frequency of appearance of each SNP in the different samples. This information is displayed as a bar graph showing the frequencies of each SNP which surpass the threshold value selected formerly by the user, along with a corresponding table which serves as an index.
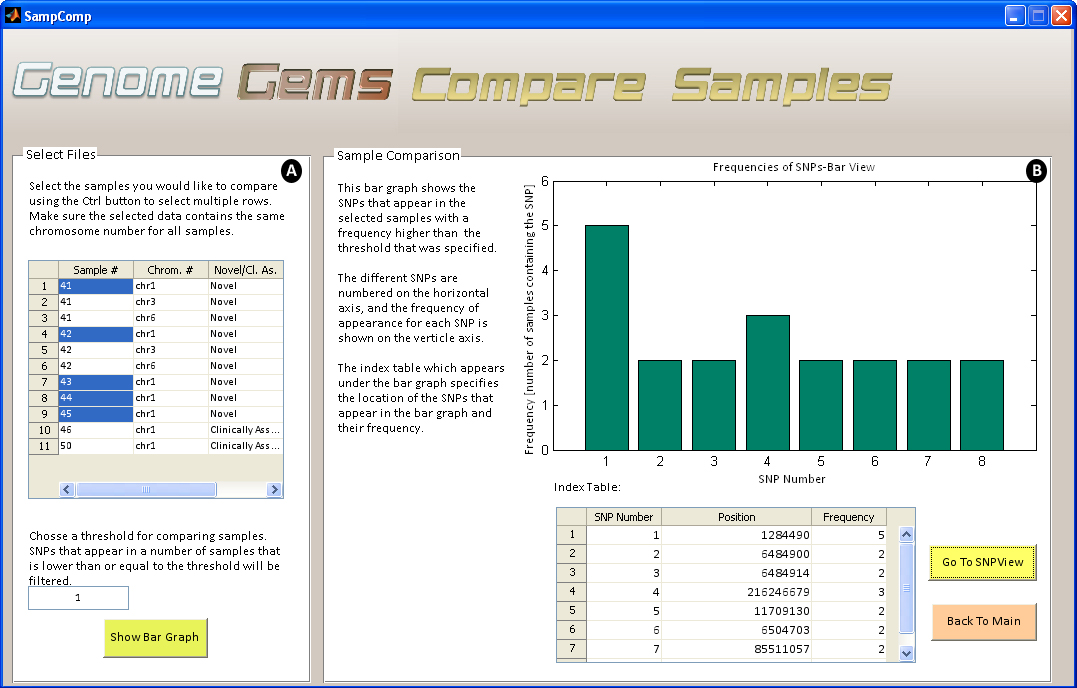 Figure 7- The Compare Samples interface allows the user to (A) select files for comparison and choose a threshold for minimal SNP frequency and (B) view the results in a bar graph and a corresponding index table.
SNP View
Upon selection of desired files for analysis, the SNP View interface displays a table containing the sample numbers that include each SNP in the specific chromosome defined formerly. This data may be useful for further analysis by the users, and can be easily exported to Excel.
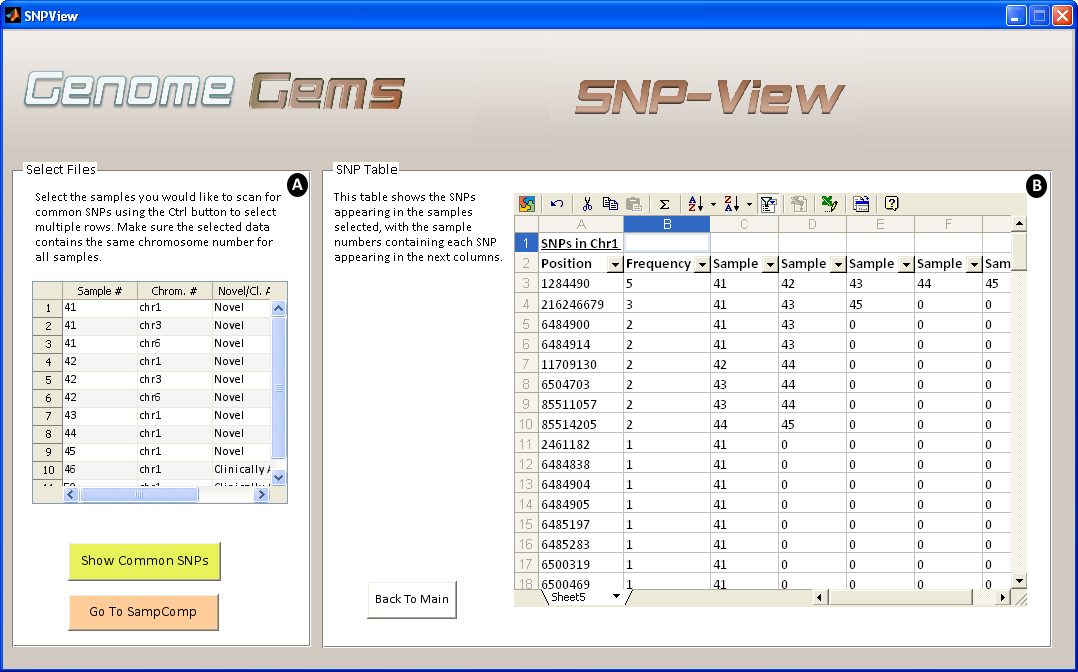
Figure 8- The SNP-View interface allows the user to (A) select sample files for comparison comtaining the same chromosome number and (B) view a list of SNPs appearing in the selected samples, in the specified chromosome, with a list of the samples in which each SNP appears. The list may be easily exported to Excel for further analysis.
PgSNP
UCSC
Many tools have been developed to examine the structure and function of the human gene set. For this purpose, genome browsers such as NCBI and UCSC have been designed. GenomeGems is designed to be compatible with the UCSC Genome Browser, created by the University of California Santa Cruz, as it is commonly used to analyze genetic information. It provides a graphical display of related genes that can be organized based on specific criteria such as expression levels, proximity in genome, protein similarity, and Gene Ontology (GO). By using GenomeGems, users can convert the original format of data into a format that can be viewed conveniently in UCSC using UCSC's custom tracks.
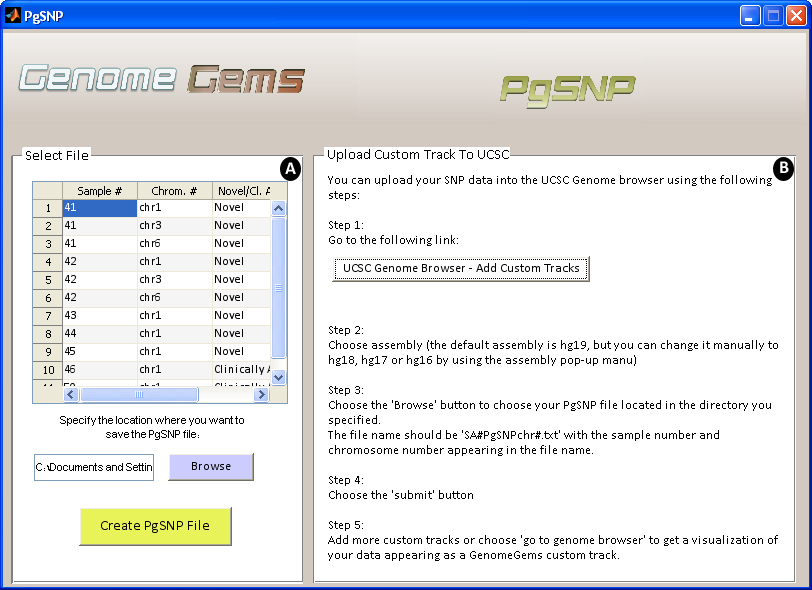
Figure 9- The PgSNP interface allows the user to (A) choose a file for conversion to PgSNP format and specify the location where the file will be saved, and (B) instructs the user how to upload the file to UCSC as a Custom Track in five simple steps.
Custom Tracks in the UCSC
Custom tracks enable research scientists using the UCSC Genome Browser to visualize their own results or annotation tracks alongside standard annotation tracks. This simple tool may be used to display locations of SNPs as well as other information regarding each SNP. GenomeGems uses an algorithm for generating PgSNP files from the original data files, which can then be uploaded as a custom track in the UCSC Genome Browser. A display of the SNPs uploaded by the user is easily created and additional information supplied by UCSC can be viewed. The additional information supplied by UCSC is the context of the SNP – CDS or Intron, and the properties of the changed amino acid – polarity, acidity and hydropathy, as seen in Figures 10 and 11.
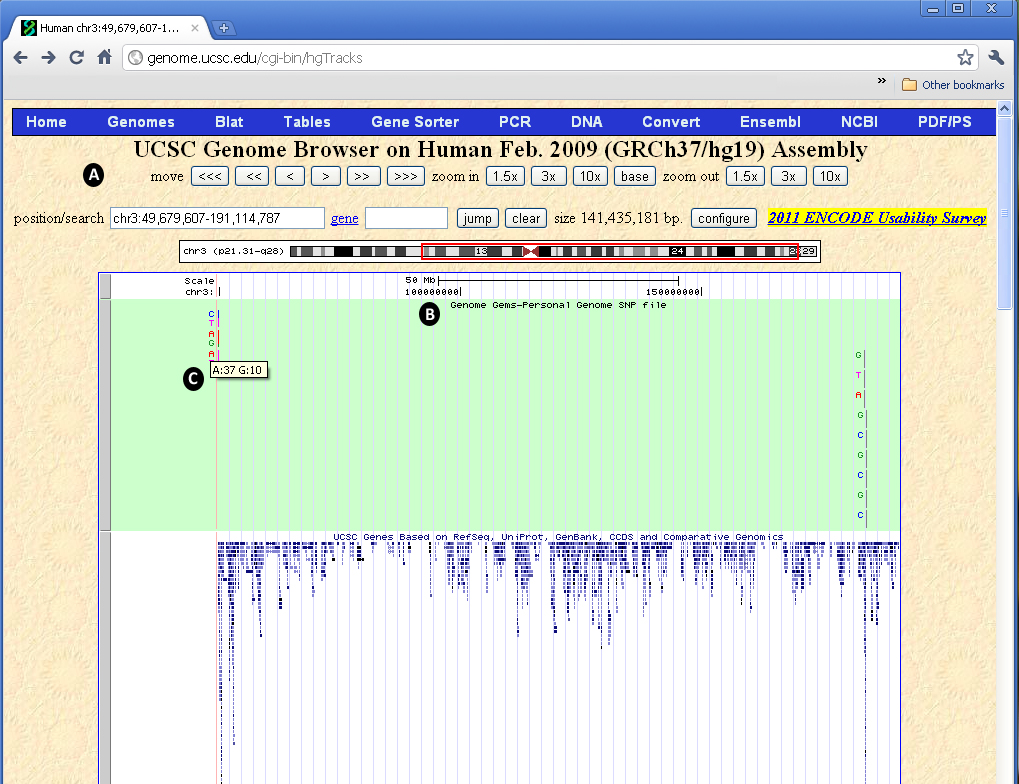
Figure 10- The UCSC Genome Browser allows the user to view the data uploaded into GenomeGems as a custom track. (A) The user can manipulate the view with options of move, zoom in, and zoom out, (B) the custom track appears at the top of the screen and can be set to hide, dense, squish, pack and full, and (C) when the user moves the mouse control over the specific SNP, the frequency of each allele is shown
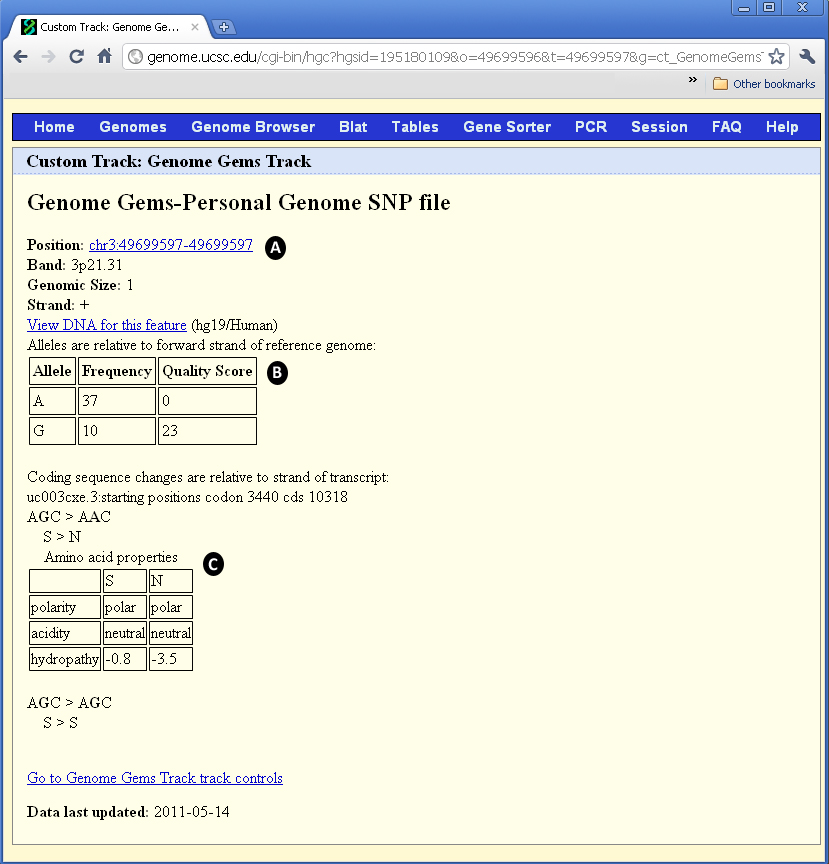
Figure 11- When the user chooses one of the SNPs appearing in the UCSC visualization interface, a new window opens containing (A) the position of the SNP, in addition to band, genomic size and strand, (B) the frequency and quality score for each allele, and (C) the properties of the changed and original amino acids: polarity, acidity and hydropathy. Notice the alleles are relative to forward strand of reference genome, and the coding sequence changes are relative to the strand of transcript.
Additional Information
For further investigation and annotation of specific SNPs and of the impacts of amino acid changes encoded by the mutant gene on a human protein, GenomeGems suggests additional external useful links: PolyPhen-2, ConSurf Server, TMpred, OMIM and UCSC, (See Figure 12). The Additional Information interface will be updated in the next versions of GenomeGems to enable direct referral to a specific entry in the databases, based on the user's SNP selection.
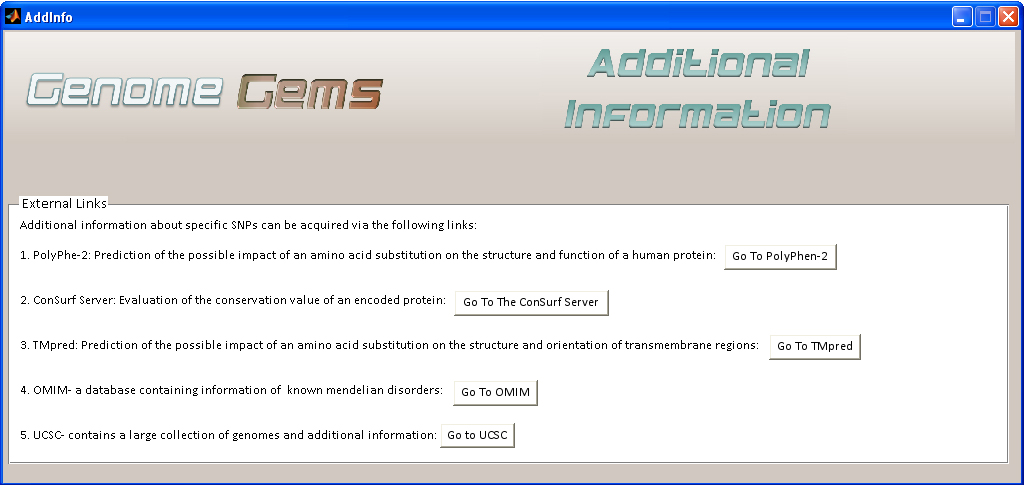
Figure 12– The Additional Information interface enables quick transfer to suggested additional databases for further analysis of SNPs.
Application Summary
GenomeGems enables researchers to identify a disease causing mutation in an efficient manner from pre-processed genomic data. Compared to currently available tools for visualization of Deep Sequencing data, its main advantage lies within the improvement of the final steps of data analysis and hypothesis generation, based on large datasets of genomic data.
Contact
For technical support, or other questions please contact GenomeGem@gmail.com