The work described in this summary focuses on coronary modeling, as an important first step in any clinical coronary evaluation, and in particular, as a major component towards blood-flow measurement. In this study we concentrate on a large group of QCA algorithms that are based on estimating the centerline as a preliminary and essential step in assessing clinical parameters such as stenosis severity.
Although the centerline plays an important role in assessing coronary geometry, little has been done in terms of examining the estimated centerline accuracy. The validation methodology in most of the QCA algorithms is based on comparing its results to specialists assessment or by generating phantoms of know parameters to which the algorithms results are compared. Both methods are far from ideal. The first one suffers from the same shortcomings that drove to the creation of automated QCA methods. The second supplies an overall performance measure, yet the difficulty in generating a large variety of different and complex vessel structures with known geometrical parameters limits this method to only simple geometric test cases.
In this work we propose a new method for performance evaluation combining an objective accuracy measure and a mathematically derived vessels centerline to which the estimated centerlines are referenced. This method is incorporated into an interactive, downloadable software tool, enabling an objective and fully automated performance evaluation.
A common way to describe a vessels projection is by its centerline and by its diameter as a function of the centerlines arc-length. In the proposed methodology instead of extracting the vessels centerline from its borders, we construct the vessels borders given a centerline and a diameter function (D.F.). The angiograms generation process is broken into the following steps (Fig.1): 1) Generating the centerline by concatenating segments of constant curvature, 2) Producing lines perpendicular to the centerline (profiles), 3) Defining the vessels borders points as the points along the profiles whose distances from the centerline correspond to the appropriate value of the D.F.
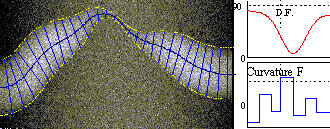
Fig 1 A section of a synthetic angiogram (left) and its centerlines curvature (lower right) and diameter (upper right) functions. The centerline, profiles (solid) and borders (dashed) lines are superimposed on the angiogram for illustration purposes.
The D.F. is determined by a combination of an exponentially decaying function and a Gaussian function, simulating the vessels natural narrowing and stenosis respectively, and 4) Introducing densitometric information. A set of objective accuracy measures based on the calculation of the estimated centerlines distance and orientation errors is used to evaluate the algorithms performance.
A simulation tool based on this methodology was developed. The tool was used to generate 75 synthetic angiograms and to evaluate two QCA algorithms performances as a function of the simulated arterys geometrical parameters. A graphical user interface is incorporated into the tool for a convenient control of the generated vessels parameters. This work holds great potential for the analysis of existing QCA algorithms and for the development of new and improved algorithms. We plan to use the simulation tool in future work involving the estimation of blood flow dynamics within the coronary.
* This work was done with Master student: Moshe Laifenfeld, in collaboration with Dr. Ofer Barnea.
