
In-Vitro System
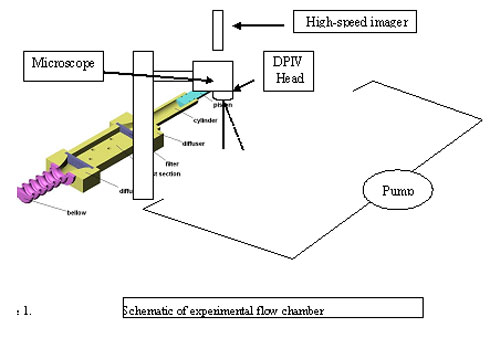
A general scheme of the experimental apparatus is shown in Figure 1. This in vitro model of a pulastile flow circuit which is driven by a computerized pulsatile pump. The circuit simulates pulsatile blood flow above a cultured layer of cardiovascular cells within a compliant surface, and equipped with an adjustable pressure regulator. A reservoir provided fluid to the pump and allowed for close circuit operation. The flow parameters are measured by our own Micro Laser Doppler Anemometry MLDA and Micro Digital Particle Image Velocimetry (DPIV) system, and are sampled by A/D card and displayed on the PC monitor. The experimental setup is constructed to allow a range of tests for exploration of all the desired parameters. Velocity waveforms generated by the drive system are controlled with micromotor technology. Through our own developed software, the fluid dynamics can be programmed to simulate waveforms ranging from uniform laminar flows to more complex arterial waveforms. Precise control of the motor permits real-time, or "on-the-fly" changes in acceleration/deceleration rates and flow directions, which are important features for replicating arterial-type flows. The mean and pulse flow rates are capable of being adjusted to simulate a range of physiologic, negative, reversal and disturbed flow conditions. The precision at which the programmed waveforms are replicated by the motor is ~0.02%. The waveform includes several major characteristics, including a maximum shear stress of 20 dyne/cm2 during peak systole, flow reversal during diastole that can reach -3 dyne/cm2, with a time-average shear stress of up to 7.5 dyne/cm2 at a frequency of 1Hz, and an oscillatory shear index of up to 0.01. The biomechanical limits of this waveform (i.e., maximum, minimum, and time-average amplitude of shear stress) conforms to published results of near wall shear stress computations in the suprarenal and infrarenal region of the abdominal aorta using MRI techniques, in which maximum shear stress during systole ranged between 30 to 60 dyne/cm2, minimum shear stress during flow reversal was -4 to -13 dyne/cm2, and mean (time-averaged) shear stress ranged between 3 to 7 dyne/cm2. The waveform in Figure will be used for all the arterial flow experiments in this study.
The cells used for this experiments are human Endothelial Cells (HUVEC) will be plated from the same pooled batch (subculture 1) at an initial density of 70,000 cells/cm2 onto a 0.1% gelatin (Sigma) coated 100 mm culture dish for static controls and a custom designed 10.8 cm diameter polystyrene plate surface (Plaskolite, Inc., Columbus, OH) for flow experiments.
Tissue culture
We establish primary human Endothelial Cells (HUVEC) cultures. Cell were grown with RPMI containing 10 % calf serum including endothelial cell growth supplement (ECGS, Beckton Dickenson, USA) 200 ?g/ml and heparin 50 U/ml with Pen strep. Cells are plated on culture dishes coated with 0.1% gelatin.
Cell growth
For experiments, HUVEC are serum-starved with medium containing 0.5 % calf serum for 24 hrs. The cells function was evaluated for (A) growth and survival (using MTT assay). Cells grown in wells will add at the end of the experiment MTT 3-(4,5-cimethylthiazol-2-yl)-2,5-diphenyl tetrazolium bromide (5 mg/ml) to each well, and they were then incubated for 3 hours at 370C. To end the reaction HCl 0.04N in isopropanol solution was added and cells were mixed and solubilized the colored crystals. The samples were read using an enzyme-linked immuno-sorbent assay (ELISA) plate reader at a wavelength of 570 nm with a reference at 630 nm. The amount of color produced is directly proportional to the number of viable cells that measure the growth or death rate of cells.
Molecular analysis
RNA isolated for molecular gene expression, by RT-PCR for the expression of adherence junction components. RNA was extracted from the different cells (EZ RNA kit, Biological industries, Bet-Haemek, Israel). The RNA will be reverse transcripted using Murine Leukemia Virus Reverse Transcriptase, RNase H Minus, Point Mutant (M-MLV RT-H-) and oligo-dT, in order to generate cDNA (Promega, USA). This cDNA then will be used as a template for the polymerase chain reaction (PCR). The integrity of the RNA, the efficiency of RT reaction and the quality of cDNA subjected to the RT-PCR controlled by amplification of transcript of Glucose-3-Phosphate Dehydrogenase (G3PDH) is amplified with SRP polymerase (Fermentas) on PCR machine (MJ, USA) using gene specific conditions. Primers for PCR are designed by using Primers III software and PCR is analyzed followings amplification on electrophoresis on a 1% agarose gel (SeaKem GTG, FMC, USA) in Tris-Borate-EDTA (TBE) buffer stained with ethidium bromide and then will be visualized under UV light.