Diverse open systems, biotic and abiotic alike, can ex-hibit complex dynamical behavior. It has been suggested that the complexity of biotic systems can be inherently regulated via autonomous utilization of internally stored means of control; hence the term self-regulated complexity. If correct, the complex activity of biotic cultured networks should be distinguishable from that of non-autonomous abiotic systems. However, complexity is still an intuitive, blurred concept, with no agreed upon defnition, so common quantified observables associated with it are yet to be discovered. Towards this goal, we developed a set of observables constracted to capture some special features of the self-regulated activity of biological networks like neural-networks, glia-cells and heart-cells.
For that we transformed the recorded time series into a representation in its corresponding time frequency domain. Next, in order to extract the maximal information about the sequence temporal ordering and to best describe temporal motifs seen in the activity we build the best tiling combination of our sequence in the time-frequency domain. The fig shows the best tiling constructed for recorded activity and for its shuffled version (randomly reorded sequence). In the next step of analysis, we use the best tiling to define a measure for the sequence regularity (R) and its structural complexity (SC). The latter is a measure of the level of the tiling organizational-complexity enabling extraction of maximal information about the sequence temporal organization. This new analysis might be able to reveal in the future abnormality in the activity which can not be capture by the current statistical scaling methods.
Fig 1
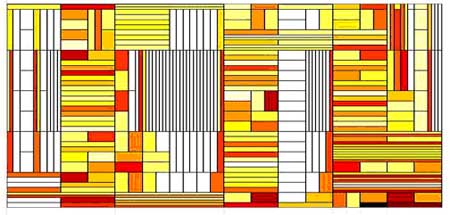
Fig 2
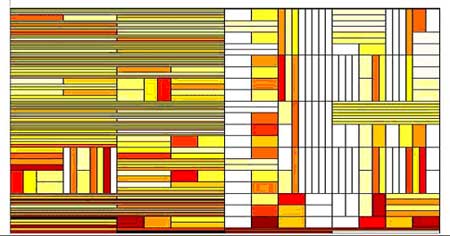
Examples of Best Tiling for the recorded sequence (above) and it's shu²ed version (below). Time is on the horizontal axis and frequency on the vertical one. The color levels represent the values of qn. Note that for the shu²ed sequence larger portions of the time-frequency domain are tiled by similar rectangles, which corresponds to weaker variations.
