A
wave geometry diagnostic
A diagnostic of the basic-state wave
propagation characteristics, which is particularly useful for determining the
existence and location of turning surfaces for meridional and vertical
propagation. The diagnostic used is a more accurate indicator of wave
propagation regions than the index of refraction because it diagnoses
meridional and vertical propagation separately. I am happy to share the fortran codes for this diagnostic or
assist in writing you own, upon request.
First some background classical wave
theory. In Cartesian coordinates, the Rossby wave equation written in terms of
the geopotential stream function is:

Where n2ref is the index of refraction squared, which equals:
![]()
Where
U, qy, and N2 are the zonal mean wind,
meridional PV gradient and Brunt Vaisala frequency, H the density scale
height, f the Coriolis parameter, and k, c are the zonal
wavenumber and phase speeds, respectively. For stationary waves, c=0.
When
n2ref is separable in the latitude and height directions, a
wave equation can be written separately in each direction, and a solution can
be obtained which his either a propagating wave or an evanescent perturbation:
 ; where the solution depends on the sign
of m2 (in WKB form):
; where the solution depends on the sign
of m2 (in WKB form):
·
m2<0, ![]() - wave propagation.
- wave propagation.
The solution is a superposition of upward (positive exponent) and downward (negative exponent) propagating waves
·
m2>0, ![]() - wave evanescence.
- wave evanescence.
The solution is a superposition of an exponentially growing and an exponentially decaying components. For an open domain only the negative exponent satisfied the top boundary condition
· m2=0, a turning surface. Waves propagating to such a surface get reflected
·
![]() , Such a surface occurs where the waves move with the
background flow (U=c) and is
called a critical surface. This is where waves interact with the mean flow,
and get absorbed or overreflected.
, Such a surface occurs where the waves move with the
background flow (U=c) and is
called a critical surface. This is where waves interact with the mean flow,
and get absorbed or overreflected.
For
typical mean flows, n2ref is not separable in the latitude and height directions so that the division to
vertical and meridional wave propagation is not trivial. In this case, Harnik and Lindzen
(2001) showed that this separation can be diagnosed from the steady state
solution to (1) as follows (where m2 and l2
are the vertical and meridional parts of n2ref,
respectively):
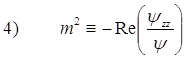

Thus,
for a given zonal mean flow structure, for specified zonal wavenumber k
and zonal phase speed c, we can calculate the vertical and meridional
wavenumbers m and l, which if real are indicative of wave
propagation and if imaginary are indicative of wave evanescence. The lines of
zero m and l are the correspondingly the reflecting surfaces for
vertical or meridional propagation. Thus, m and l are diagnostics
of the mean flow propagation characteristics for the particular zonal mode k,
c, and not of the wave itself, which can vary in time, depending
strongly on the characteristics and evolution of the wave sources and
sinks.
Example
from a linear QG model on a β plane:
The basic state zonal wind (left) and meridional PV gradient (right, in units of β):

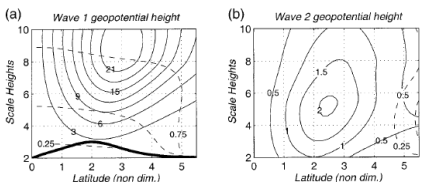
The
corresponding wave geopotential height amplitude, for stationary zonal
wavenumbers 1 (left) and 2(right), along with the latitudinal shape of the wave
amplitude of the lower level forcing (the wave forcing was constant with
latitude and time):
From
these steady state wave solutions we calculate the meridional and vertical
wavenumbers. In the following figure we show n2ref, m2, and l2 (respectively from left to right) for zonal
wavenumbers 1 (top row) and 2 (bottom row), where wave evanescence regions are
lightly shaded, and the wave propagation characteristics, including meridional
and vertical reflection are schematically drawn:

We
see that the n2ref gives a
relatively good indication of the meridional propagation regions but less so of
the vertical propagation regions. In particular, n2ref is positive
at all heights in the meridional waveguide region, while m2 is negative at upper levels. We
also see that while n2ref suggests a diminished waveguide for wave 2 compared to
wave 1, the wavenumbers show that the meridional waveguide is very similar and
most of the difference is in the vertical propagation. For more details of this
example see Harnik and Lindzen
(2001).
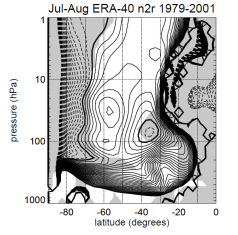
Another
example from observations that n2ref does not
represent the wave geometry accurately enough is seen from the climatological n2ref vs m2, and l2 for Sep-Oct vs Jul-Aug using ERA40 from 1979-2001: while the index of refraction seems
qualitatively similar, during Sep-Oct there is a vertically bounded meridional
waveguide and downward wave reflection, while during Jul-Aug waves propagate
vertically through the stratosphere (figures prepared by Tiffany Shaw):